Charts
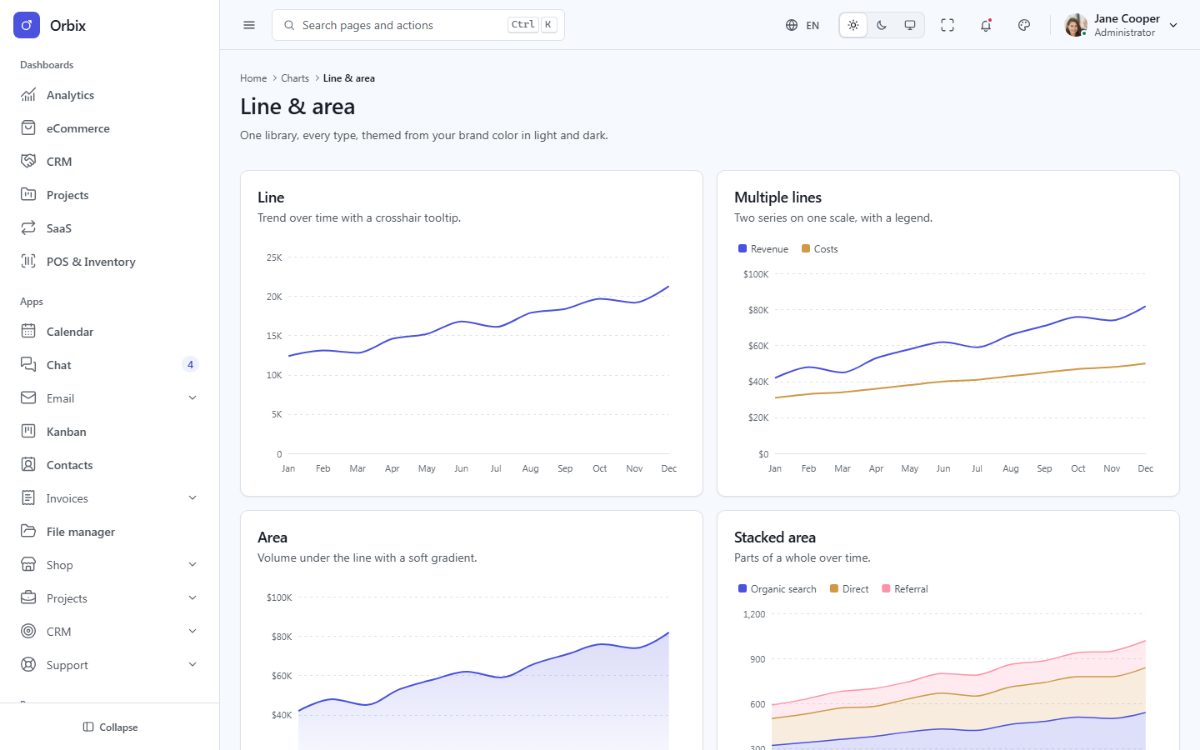
Charts use Apache ECharts, bundled locally and tree-shaken (line, bar, pie, radar, scatter, gauge, funnel and heatmap charts, SVG renderer). Every chart reads its colors from the design tokens, so it follows the brand preset, the dark mode, the language (number formats) and the text direction, resizes with its container and is disposed when its page unmounts.
Add a chart
Use the useChart hook in any component and attach the returned ref to a container (give it an accessible name):
import { useChart } from '@/hooks/useChart';
import { useI18n } from '@/hooks/useI18n';

const online = [42, 51, 48, 62, 70, 78];
const stores = [30, 32, 35, 33, 38, 41];

export function SalesChart() {
  const { t } = useI18n();
  const ref = useChart<HTMLDivElement>((c) => ({
    xAxis: c.category(c.months(6)),
    yAxis: c.value(c.fmt.compactCurrency),
    series: [
      { type: 'bar', name: c.t('reports.sales.online'), data: online, itemStyle: { color: c.colors[0] } },
      { type: 'line', name: c.t('reports.sales.stores'), data: stores, itemStyle: { color: c.colors[1] } },
    ],
  }));
  return (
    <section className="fd-card">
      <div className="fd-card__body">
        <div className="fd-chart" ref={ref} role="img" aria-label={t('reports.sales.chart')} />
      </div>
    </section>
  );
}
The callback receives a context c with the themed colors (c.colors – the categorical palette, c.primary,
c.success, c.text, c.border...), axis helpers (c.category(), c.value(), c.months()), the translator
(c.t) and locale-aware formatters (c.fmt). It runs again whenever the theme, the language or the direction
changes, so never cache colors outside it.
Update the data
Pass dependencies to rebuild the chart when your data changes:
const ref = useChart<HTMLDivElement>((c) => ({ /* ...uses `period`... */ }), [period]);Charts created by page scripts with chart('#id', (c) => ({ ... })) (from src/core/charts.ts) are re-rendered
with refreshCharts().
More examples
The Charts pages (line and area, column and bar, mixed, pie/donut/gauge, radar/scatter/bubble) and the six
dashboards contain more than 35 ready-made charts: their options are in src/scripts/charts.ts and
src/scripts/dashboards/, and the same option objects work in useChart. To use another ECharts chart type,
register it in src/core/charts.ts (echarts.use([...])).